Eheim pHcontrol+ custom graph
In the world of aquarium enthusiasts, embracing technology has become a thrilling trend, and my recent foray into the realm of aquatic digitalization has led me to explore the exceptional offerings from Eheim.
Eheim has long been a frontrunner in the aquarium hobby industry, and their latest venture, Eheim Digital, is a testament to their commitment to innovation and excellence.
In an era where home automation reigns supreme, Eheim has arrived right on schedule to cater to the needs of aquarists who appreciate the wonders of automation. The world of smart homes has witnessed a surge in automated gadgets, from heating systems and air conditioners to Wi-Fi-controlled outlets, light bulbs, and even motorized curtains. It's only natural that aquarium enthusiasts would also be drawn to the allure of automation, and Eheim is here to make that dream a reality.
 davidm-glitch
I must confess that my initial attempt at integrating Eheim Digital with Home Assistant met with some challenges and didn't quite hit the mark. However, I remain optimistic and plan to give it another shot in the future.
Instead of dwelling on my integration struggles, I'd like to share an alternative approach I took to monitor and plot my aquarium's pH values using a small Raspberry Pi connected to my Wi-Fi network. This journey began when I discovered that my pHcontrol+ device had a websocket that exposed its data. Being a Linux enthusiast, I embarked on a quest to find a suitable tool to tap into this data stream.
A quick web search for "websocket and bash" led me to a fantastic tool known as 'websocat,' which was available for download on its GitHub repository. After downloading, renaming, granting execution permissions, and copying it to a path folder, I had 'websocat' readily available for use across my Linux system.
With the knowledge of my pHcontrol+ system's IP address, I queried it using 'websocat' and received a wealth of data. Amongst this data, the most intriguing part was the section beginning with "title": "PH_DATA" at the end of the received data block.
[{"title":"USRDTA","from":"CC:DB:A7:DD:DA:D8","name":"pH Control","aqName":"Vivaline 240","version":9,"language":"ES","timezone":60,"tID":32,"dst":1,"tankconfig":"PH","power":"9","netmode":"ST","host":"eheimdigital","groupID":0,"meshing":1,"firstStart":0,"revision":[2021,2021],"latestAvailableRevision":[1008,1013,2000,2000],"firmwareAvailable":0,"softChange":0,"emailAddr":"","liveTime":25740,"usrName":"","unit":0,"demoUse":0,"sysLED":25},{"title":"CLOCK","from":"CC:DB:A7:DD:DA:D8","year":2023,"month":10,"day":2,"hour":16,"min":22,"sec":13,"mode":"DAYCL_MODE","valid":1},{"title":"NET_ST","from":"CC:DB:A7:DD:DA:D8","dhcp":1,"ip":[192,168,5,241],"gateway":[192,168,4,1],"subaddress":[255,255,252,0],"stSSID":"ADAMO-HQPS","stPW":"Yes"},{"title":"NET_AP","from":"CC:DB:A7:DD:DA:D8","apSSID":"EHEIM pHcontrol 14539480","apPW":""},{"title":"MESH_NETWORK","to":"USER","clientList":["84:F3:EB:AA:40:E6","CC:DB:A7:DD:DA:D8"]}]
{"title":"PH_DATA","from":"CC:DB:A7:DD:DA:D8","sollPH":69,"isPH":70,"active":1,"hystLow":1,"hystHigh":1,"offset":0,"valveIsActive":0,"acclimatization":0,"mode":2,"expert":0,"sync":"84:F3:EB:AA:40:E6","partnerName":"Luces","dayStartT":480,"nightStartT":1200,"nReduce":-3,"alertState":0,"serviceTime":42,"kH":5,"schedule":[[450,74],[1080,78]]}
I refined and extracted the data I needed using the following command:
websocat -t -E ws://192.168.5.241/ws --max-messages-rev 2 | grep PH_DATA | jq .And there it was, exactly what I was looking for—a concise dataset containing pH information and related parameters.
{
  "title": "PH_DATA",
  "from": "CC:DB:A7:DD:DA:D8",
  "sollPH": 69,
  "isPH": 70,
  "active": 1,
  "hystLow": 1,
  "hystHigh": 1,
  "offset": 0,
  "valveIsActive": 0,
  "acclimatization": 0,
  "mode": 2,
  "expert": 0,
  "sync": "84:F3:EB:AA:40:E6",
  "partnerName": "Luces",
  "dayStartT": 480,
  "nightStartT": 1200,
  "nReduce": -3,
  "alertState": 0,
  "serviceTime": 42,
  "kH": 5,
  "schedule": [
    [
      450,
      74
    ],
    [
      1080,
      78
    ]
  ]
}
With this data in hand, my next task was to save it periodically. I crafted a simple bash script to accomplish this:
#!/bin/bash

while true
do
	clear
	echo "Press [CTRL+C] to stop.."

	DATA=$(/usr/local/bin/websocat -t -E ws://192.168.5.241/ws --max-messages-rev 2 | grep PH_DATA)

	if [ $? ]; then

		rawPH=$(echo $DATA | jq .isPH)
		PH=$(echo "scale=1; $rawPH/10" | bc)
		VALVE=$(echo $DATA | jq .valveIsActive)
		DATE=$(date '+%d/%m/%Y %H:%M:%S')

		echo "$DATE,$PH,$VALVE" >> ph_data.csv
		echo "Current pH = $PH"

	fi

	sleep 600

done
This script essentially operates within an infinite loop. It queries the websocket each 10min, extracts relevant variables, and saves them to a file with timestamped entries.
The resulting file appears as follows:
29/09/2023 18:20:24,6.8,1
29/09/2023 18:30:26,6.8,1
29/09/2023 18:40:27,6.8,1
29/09/2023 18:50:29,6.8,0
29/09/2023 19:00:30,6.8,0
29/09/2023 19:10:32,6.8,0
This CSV file contains three columns: Date and time, pH, and the status of the CO2 valve (0 for closed, 1 for active).
Now, armed with this collected data, we can visualize the pH trends using a graph. I turned to the power of open-source software once more, using GnuPlot for the task. Here's the configuration file (plot.gp):
set datafile separator ','
set xdata time
set timefmt '%d/%m/%Y %H:%M:%S'
set format x "%d-%m %Hh"
set yrange [5:8]
set ylabel word("pH", 1)
set title "pH Control"
set xlabel word("Date", 1)
set xtics rotate by 45 offset '-1.8','-2.6'
set key top left autotitle columnheader
set grid
show grid
plot 'plot.csv' using 1:2 lt rgb 'red' with lines , \
     'plot.csv' using 1:($3*7) pt 7 ps 1 lt rgb 'blue'
To generate the graph, execute the following command:
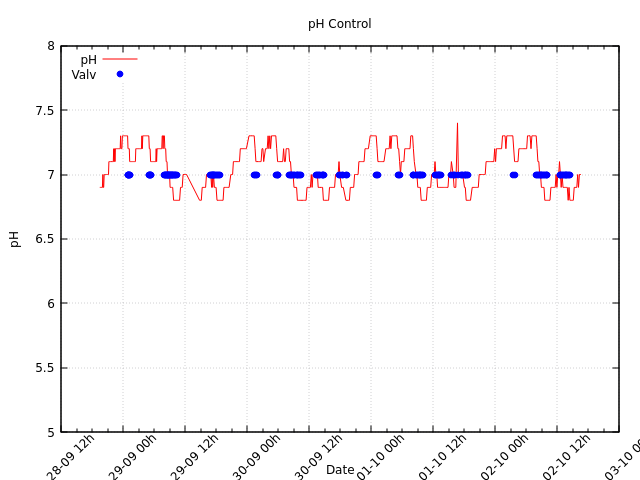
gnuplot -p plot.gpThe resulting graph depicts the evolution of pH values over time. Notably, I've set two distinct target pH values—one for the day (6.9) and another for the night (7.2). The oscillating pattern of the red line is a result of the system's hysteresis, triggering the valve when a certain value is reached and then closing it once the pH reaches its target. The blue dots represent periods when the CO2 valve is open and carbon dioxide is being injected into the tank.
In conclusion, this DIY approach to monitoring and visualizing aquarium pH trends provides valuable insights into the well-being of your aquatic ecosystem. With a Raspberry Pi, 'websocat,' and GnuPlot, you can transform your aquarium hobby into a captivating digital adventure, all while keeping a close eye on your pH levels and ensuring the optimal conditions for your aquatic inhabitants."
I submited all files mentioned in this article to my Github repository here:
derfredy"Please extend my regards and best wishes to Carlos from DonDisco, the go-to destination for aquarium enthusiasts in our city."