Monitoring Klever

I would use 2 different machines, one for prometheus and one for grafana. You could use the same server though. What I would never do is to use the same server you are trying to monitor.
Install and configure prometheus. This is the longest and more complex task. It will fill an article itself. I would recommend you to read a couple of articles that treat this topic in deep before starting. This is just an example of systemd service for prometheus. You will need to create most of prometheus folders by hand.
[Unit]
Description=Prometheus systemd service unit
Wants=network-online.target
After=network-online.target

[Service]
Type=simple
User=prometheus
Group=prometheus
ExecReload=/bin/kill -HUP $MAINPID
ExecStart=/usr/local/bin/prometheus \
--config.file=/etc/prometheus/prometheus.yml \
--storage.tsdb.path=/var/lib/prometheus \
--web.console.templates=/etc/prometheus/consoles \
--web.console.libraries=/etc/prometheus/console_libraries \
--storage.tsdb.retention.size=25GB \
--web.listen-address=127.0.0.1:9090 \
--web.external-url=https://localhost:9090/prometheus/ \
--web.route-prefix=/

SyslogIdentifier=prometheus
Restart=always

[Install]
WantedBy=multi-user.target
Modern network daemons use to export their metrics. This is the case of all tendermint and substrate binaries. You will only need to know which port they are using (26656 and 9615 are widely used). Sometimes you have to add a flag or change a config parameter to "true" in order to start exposing the metrics.
To monitor common system metrics we will export them using node_exporter. This is a bash script that will install and create the service for you:
#!/bin/bash

# Install node_exporter and system service
# Usage:  run as root
#
# Author: @derfredy:matrix.org
#

# Package version
VERSION="1.3.1"

cd /usr/local/
wget https://github.com/prometheus/node_exporter/releases/download/v${VERSION}/node_exporter-${VERSION}.linux-amd64.tar.gz
tar xzvf node_exporter-${VERSION}.linux-amd64.tar.gz
rm node_exporter-${VERSION}.linux-amd64.tar.gz
mv node_exporter-${VERSION}.linux-amd64 node_exporter

cat > /etc/systemd/system/node_exporter.service << EOF
[Unit]
Description=node exporter system service
[Service]
ExecStart=/usr/local/node_exporter/node_exporter
User=root
Restart=always
RestartSec=3
[Install]
WantedBy=multi-user.target
EOF

systemctl enable node_exporter
systemctl start node_exporter
So now we will have our machine system metrics ( ram, cpu, disk...) exposed at port 9100 and if we are running a tendermint or substrate node we will also have specific metrics being exported by the daemon itself.
It is time to scrap those metrics. This is the main job of Prometheus. Let's have a look to its config file, prometheus.yml
  #[...common standard stuff...]

  # Scrapping jobs start here:

# System standard metrics exported with node_exporter
  - job_name: 'node_klever'
    static_configs:
    - targets: ['69.69.69.69:9100']
      labels:
        network: 'klever'
        hostname: 'klever-tesnet'

# Specific metrics of the node
  - job_name: 'klever'
    static_configs:
    - targets: ['69.69.69.69:8080']
      labels:
        network: 'klever'
        hostname: 'klever-testnet'
Note: change 69.69.69.69 for the IP of the server you are interested in.
Once our prometheus is scraping the metrics we can start ploting them from Grafana. So you will need to install the Grafana service and configure its source of data to point to our prometheus server and service.
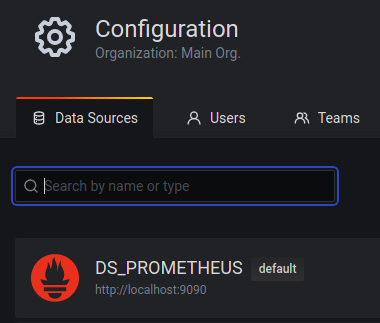
That is done in Grafana -> Configuration -> Data Sources section
We will have our prometheus responding at port 9090 by default. So it will look like this:

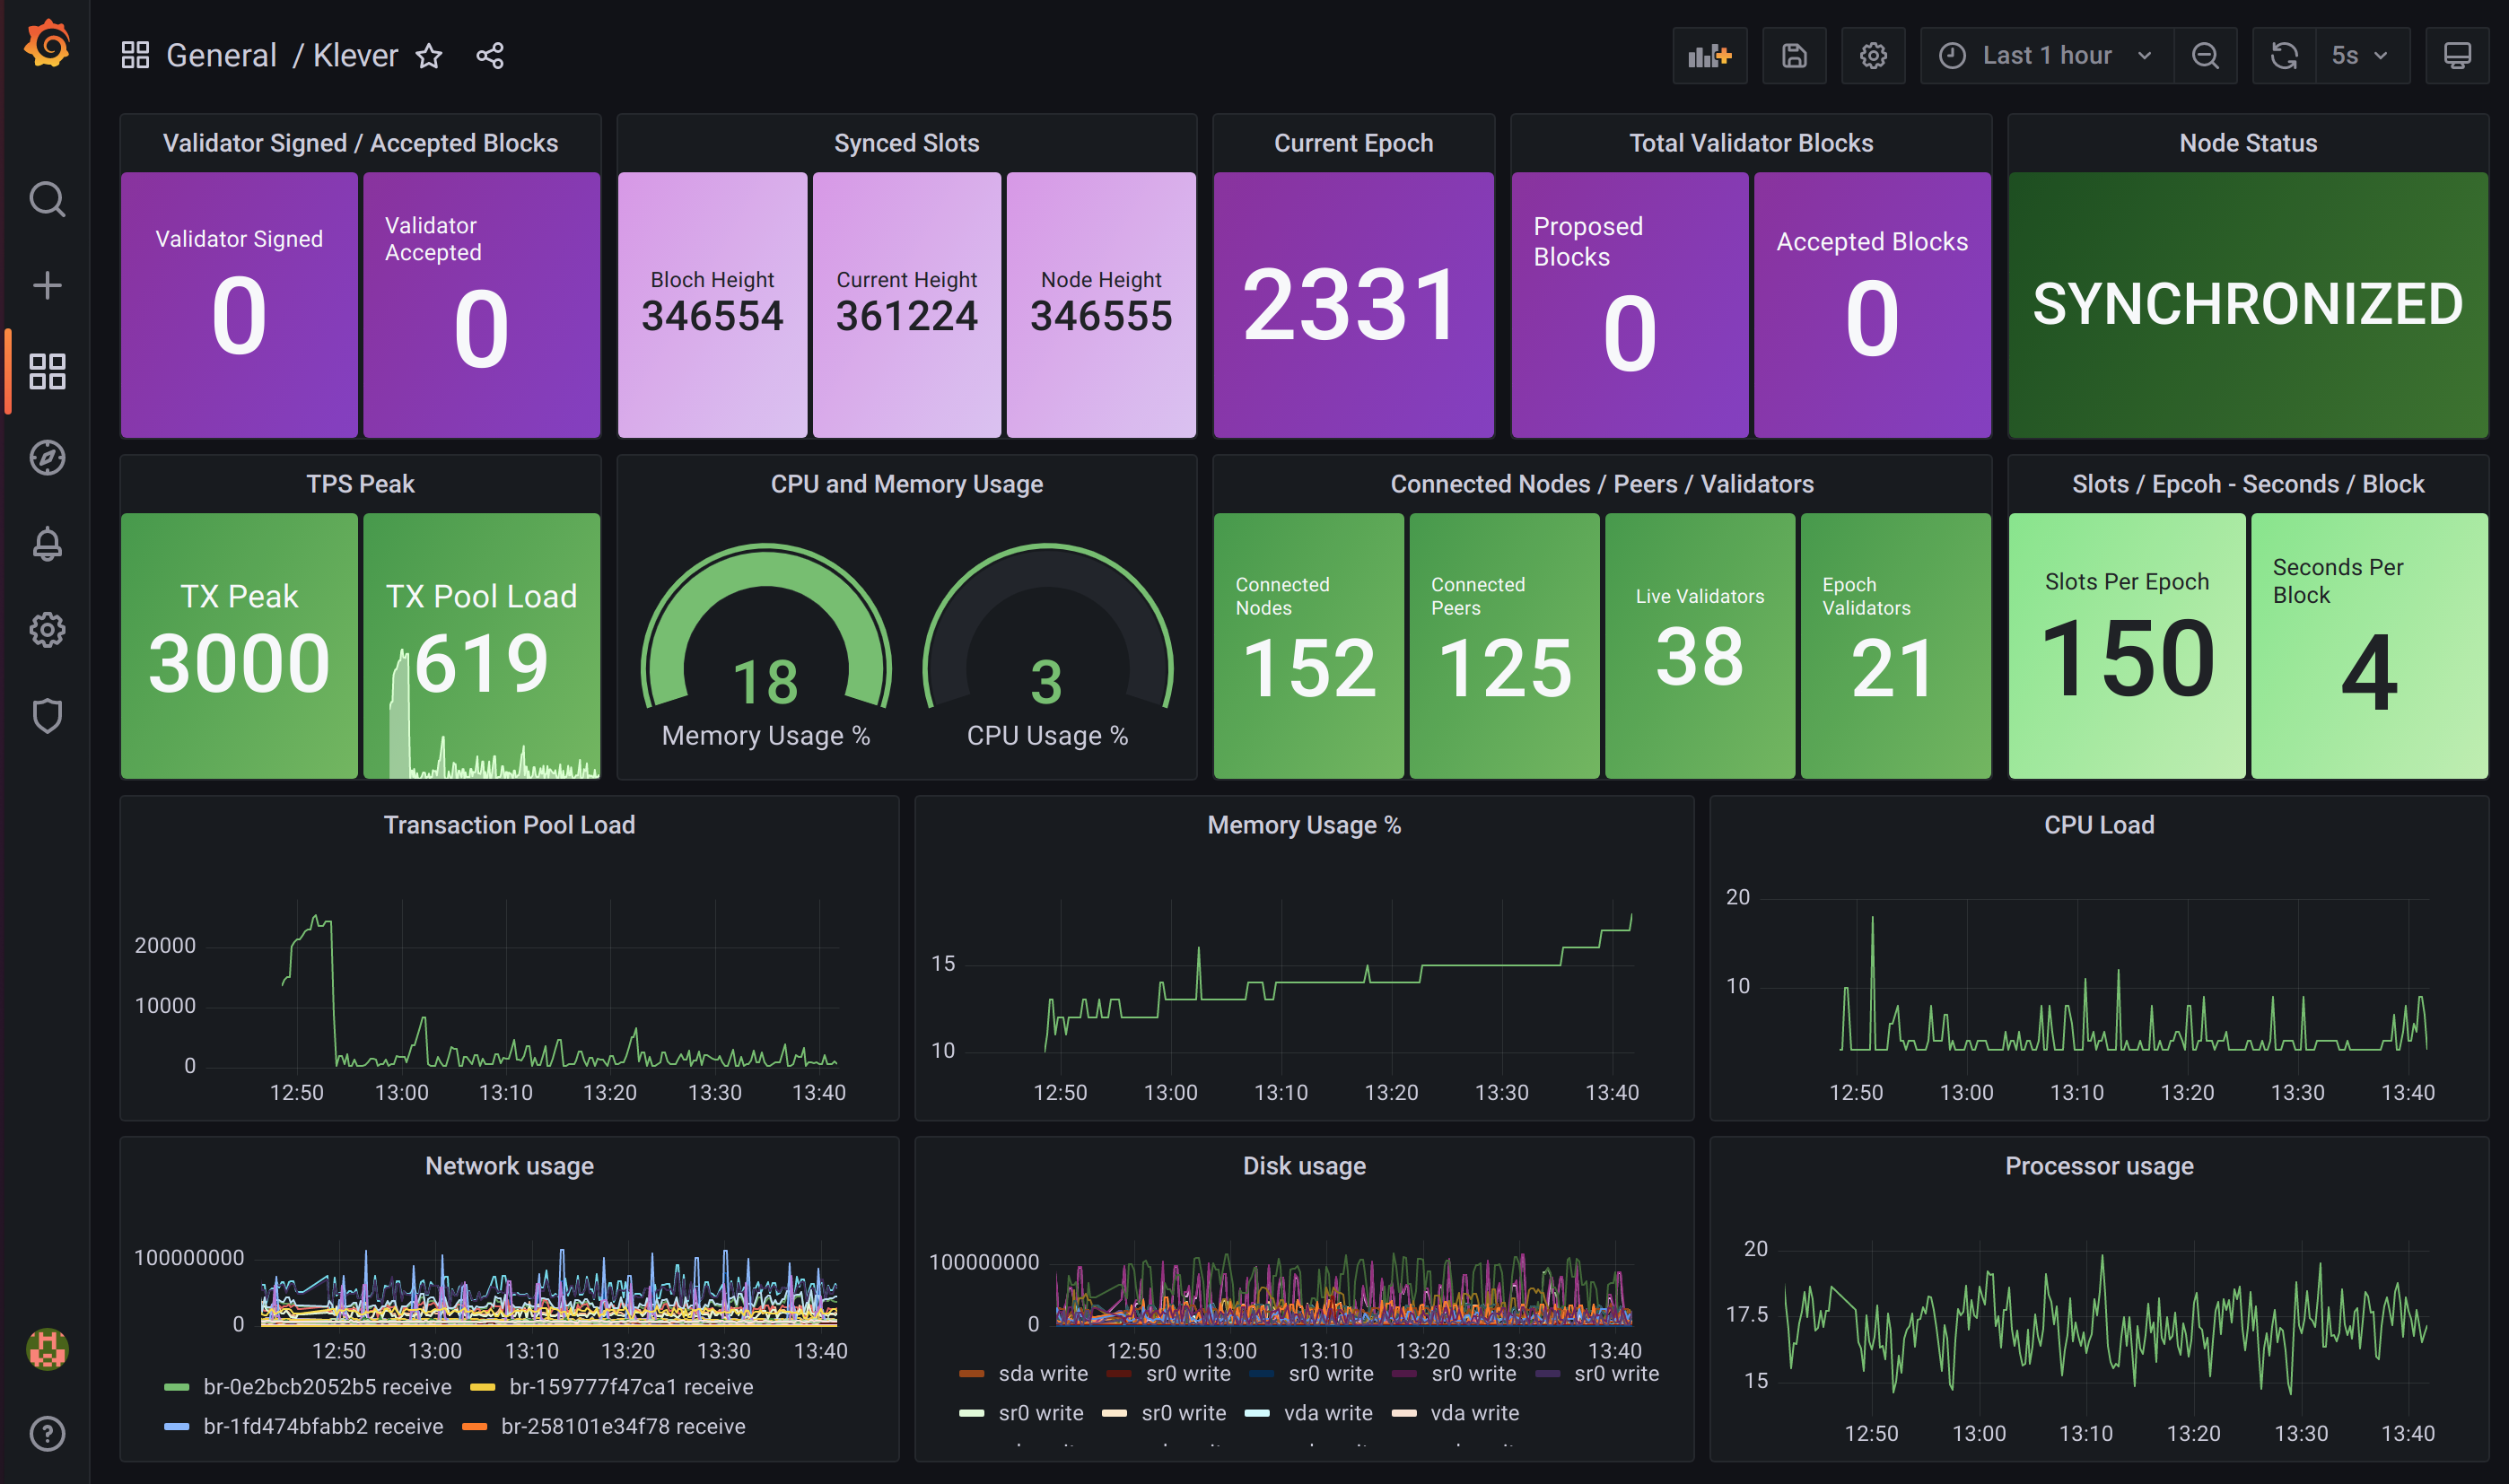
Finally we will start adding Panels to Grafana. Each Dashboard is comprised by panels. They are totally customizable and you will be able to plot the metrics that you are interested in. To make this step easier I have uploaded an already designed dashboard.

You can download previous dashboard from here:
https://blog.derfredy.com/uploads/klever-dashboard.json
I hope you enjoyed this article.
It is not finished yet, and I will consider this a live article that I will be updating periodically
DerFredy | DragonStake.io
